|
By Mark Benthien
Background of LARSE I and II
After each large earthquake, residents
of southern California ask if a strong earthquake can occur near
their home and how the ground will shake due to any large earthquake
in the region. Scientists are working to answer these questions
so that damage or injury due to earthquakes can be reduced. An
important step in this process is to have an accurate picture
of the network of active faults and other structures that underlie
the Los Angeles region. The Los Angeles Region Seismic Experiment
(LARSE), a cooperative scientific effort of SCEC, the United
States Geological Survey (USGS), and many other domestic and
international organizations, was designed to obtain detailed
images of the geologic structure of the region -- particularly
of deep, unknown faults where earthquakes will certainly occur
in the future.
|
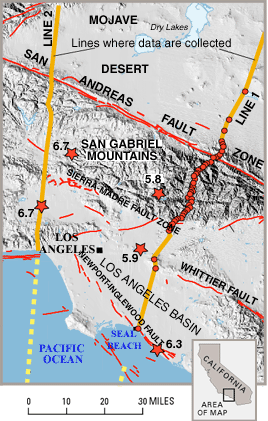
Location of LARSE I (Line 1 and
2) and LARSE II (Line 2) (From USGS LARSE Fact Sheet)
|
The LARSE method uses sound waves traveling
beneath the Earth's surface to produce these images. The method
is similar to the method used to create an ultrasound image.
For LARSE I
(October, 1994), sound waves were generated by 60 charges detonated
over 60 feet beneath the surface in specially-drilled boreholes,
located approximately 1 kilometer (0.6 miles) apart. The sound
waves were recorded by over 600 portable seismographs spaced
every 100 meters (approximately 100 yards) along the same line.
The main line extended from Seal Beach to Barstow. Two other
lines of seismometers, with no explosions, were also deployed,
one running east-west across the L.A. Basin, and another north-south
from Pacific Palisades to Lancaster. In addition to the "onshore"
explosions, a ship pulling an airgun array extended all three
lines into the ocean by firing compressed air bursts into the
water, resulting in vibrations that could be recorded on instruments
along the lines.
LARSE
I provided many answers that could
not have been obtained in any other way. By 1998 analysis of
the data from LARSE I had resulted in several important discoveries.
The depth to bedrock beneath the San Gabriel Valley was shown
to be more than 3 miles, 50% thicker than prior estimates. Because
shaking potential in sedimentary basins increases with increased
thickness, earthquake hazards in the San Gabriel Valley need
to be reevaluated. Another major finding was a strongly reflective
zone deep beneath the San Gabriel Mountains. This zone begins
at about 12 miles depth near the vertical San Andreas Fault and
rises in a steplike fashion southward toward the Los Angeles
basin. It appears to connect to the fault system responsible
for the 1987 magnitude 5.9 Whittier Narrows earthquake, which
occurred on a blind thrust fault. This reflective zone is interpreted
as a "master" blind thrust fault that transfers stress
and strain upward and southward to blind thrust faults and other
faults in the San Gabriel Valley and Los Angeles basin.
LARSE I News Release, January 1, 1997
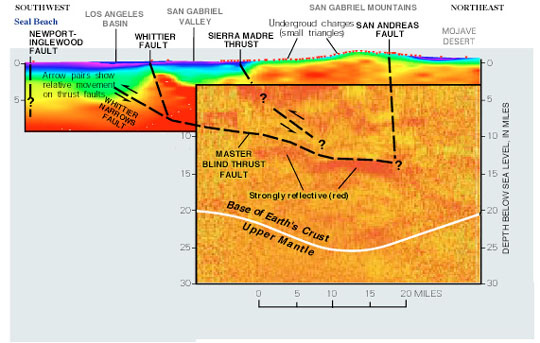 Processed LARSE I data and interpretation
(From USGS LARSE Fact Sheet)
 |
LARSE II
In October, 1999, LARSE II completed the
second north-south LARSE I line which did not have explosions
in 1994. This line stretched from Pacific Palisades to the San
Fernando Valley, then northward across the Mojave Desert to the
Tehachapi Mountains. The line was chosen in 1994 in response
to the Northridge earthquake, in order to provide information
about many underground structures. These structures include "blind"
thrust faults -- buried ramp-like faults that do not extend to
the surface, such as the fault on which the Northridge earthquake
occurred. Knowing the configuration of buried faults is crucial
to understanding how the entire earthquake-producing mechanism
works in the Los Angeles region.
Other important structures along this transect
that are along this line are sedimentary basins -- large valleys
filled with sand, clay and other erosional deposits -- such as
the San Fernando Valley. Information on the thickness and shape
of sedimentary basins is essential for predicting how the ground
will shake in future earthquakes, since deeper basins result
in stronger shaking at the surface.
For LARSE II, sound waves were generated
by 93 explosions recorded by over 1400 portable seismographs
spaced every 100 meters (approximately 100 yards) along the same
line, as well as along several cross lines in the San Fernando
Valley and Santa Monica.
Frequently
Asked Questions
LARSE
II Fact Sheet in pdf format (1
MB)
LARSE II fact sheet, online
Exploratorium Faultline Project
LARSE
II SCEC Annual Meeting Abstracts
The following abstracts are for posters
presented at the 2000 SCEC Annual
Meeting. The first research papers summarizing the results
of LARSE II will be published in the next few months, but these
abstracts provide a glimpse of the results that are beginning
to be recognized after a year of data processing. Images are
from the posters.
LARSE II: What Caused the Focusing
Related Damage in Santa Monica During the Northridge Earthquake?
 Shirley
Baher and Paul Davis, University of California, Los Angeles Shirley
Baher and Paul Davis, University of California, Los Angeles
Gary Fuis, U.S. Geological Survey, Menlo Park
Rob Clayton, California Institute of Technology
The city of Santa Monica sustained concentrated
damage from the anomalous amplification of seismic energy during
the 1994 Northridge earthquake. Several hypotheses have been
developed to explain the high amplitudes of ground motion. These
include 1) focusing by a deep geological structure which acted
like an acoustic lens, 2) a combination of focusing and shallow
basin effects, 3) shallow (less than 1 km) basin edge effects
involving constructive interference of surface and bodywaves.
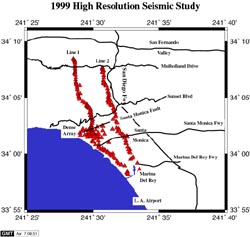
As part of LARSE (Los Angeles Region Seismic Survey) we conducted
a high resolution seismic survey of Santa Monica to test the
various hypotheses.
 The
experiment took place in two parts: 1) a refraction survey in
October 1999 which involved recording arrivals from shots and
earthquakes (including Hector Mine) on ~200 sensor array, and
2) a 10 km Vibroseis reflection survey in June 2000 through Santa
Monica and Pacific Palisades with vibes every 60 m and geophones
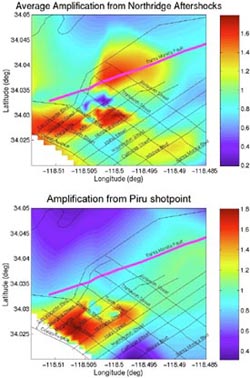
every 30m. In addition to local shots to study the structure,
two distant (4000lb) shots were detonated designed to reproduce
the focusing of seismic energy that occurred during the Northridge
Earthquake. The wave amplitudes of these shots along with Northridge
aftershocks were examined to confirm the existence of focusing.
Travel times of first p arrivals for shots and vibes have been
used to obtain a 2D velocity structure. The velocity structure
confirms existence of sub-basin in Santa Monica beneath the damage
zone bounded to the north by the Santa Monica fault. The vibroseis
experiment shows coherent reflections south of the Santa Monica
fault related to sedimentary layers in the basin. We located
the Santa Monica fault at depth about 1km north of the location
of a surface trace that was previously mapped. We also located
the unmapped Potrero Canyon fault using shots detonated in the
Santa Monica Mountains. The
experiment took place in two parts: 1) a refraction survey in
October 1999 which involved recording arrivals from shots and
earthquakes (including Hector Mine) on ~200 sensor array, and
2) a 10 km Vibroseis reflection survey in June 2000 through Santa
Monica and Pacific Palisades with vibes every 60 m and geophones
every 30m. In addition to local shots to study the structure,
two distant (4000lb) shots were detonated designed to reproduce
the focusing of seismic energy that occurred during the Northridge
Earthquake. The wave amplitudes of these shots along with Northridge
aftershocks were examined to confirm the existence of focusing.
Travel times of first p arrivals for shots and vibes have been
used to obtain a 2D velocity structure. The velocity structure
confirms existence of sub-basin in Santa Monica beneath the damage
zone bounded to the north by the Santa Monica fault. The vibroseis
experiment shows coherent reflections south of the Santa Monica
fault related to sedimentary layers in the basin. We located
the Santa Monica fault at depth about 1km north of the location
of a surface trace that was previously mapped. We also located
the unmapped Potrero Canyon fault using shots detonated in the
Santa Monica Mountains.
|
|
Upper Crustal Structure and Tectonics
along the LARSE Transects, Southern California
G. S. Fuis, J. M. Murphy, and V. E. Langenheim,
U.S. Geological Survey, Menlo Park
T. Ryberg, GeoForschungsZentrum, Potsdam, Germany
N. J. Godfrey and D. A. Okaya, University of Southern California
W. J. Lutter, University of Wisconsin, Madison
The Los Angeles Region Seismic Experiment
(LARSE) consists of two main transects (Lines 1 and 2) which
are approximately centered on the San Andreas fault in southern
California. The goal of these two transects is establish sedimentary
basin depths and structure and interconnection of faults, in
order to better assess earthquake hazards in southern California.
Airgun, explosion, and earthquake data were collected onshore
on these transects, and are discussed here; airgun data only
were collected offshore. Line 1 (1994, 160 km long) crosses the
Los Angeles basin, central Transverse Ranges (San Gabriel Mountains),
and Mojave Desert; Line 2 (1999, 150 km long) crosses the Santa
Monica Mts, San Fernando Valley, Santa Susana Mts, central Transverse
Ranges (Sierra Pelona and Liebre Mountain blocks), and western
Mojave Desert. Along both transects, the San Andreas fault is
located at or near the geographic boundary between the central
Transverse Ranges and the Mojave Desert. Chief crustal-structure
results from Line 1 are as follows: (1) In the upper 20 km of
crust, the current San Andreas fault separates low-velocity rocks
(5.8-6.0 km/s--chiefly Pelona Schist) on the south from low-
to intermediate- velocity rocks (5.5 -6.3 km/s--chiefly batholithic
and metamorphic rocks) on the north. (2) Beneath the San Gabriel
Mountains, at 20-km depth, a sequence of subhorizontal bright
reflectors terminates 3 km north of the surface trace of the
San Andreas fault, leading us to infer an average northward dip
for the San Andreas fault of over 80 degrees. A sequence of reflectors
is also seen at approximately the same depth (20 km) in the southern
Mojave Desert, but these reflectors are unconnected to the reflectors
in the San Gabriel Mountains. (3) A thin (500-m) layer of anomalously
low velocity rock (4 to 4.5 km/s) is seen between two of the
reflectors in the San Gabriel Mountains, leading us to infer
the presence of fluid-filled cracks in the mid-crust. (4) In
the lower crust, below 20-km depth, the San Andreas fault is
poorly defined in our data but appears to separate higher velocity
rocks on the south (~6.5 km/s) from lower-velocity rocks on the
north (~6.3 km/s). (5) The Moho is depressed by about 7 km (to
35-km depth) in a 40-km-wide region centered on the San Andreas
fault.
 Chief
tectonic interpretations from Line 1 are as follows: (1)The geometry
of the bright reflections beneath the San Gabriel Mountains suggests
they are linked to a master decollement that extends from the
San Andreas fault southward to the hypocenter of the 1987 M 5.9
Whittier Narrows earthquake, and perhaps even farther south.
A symmetrical decollement is interpreted in the southern Mojave
Desert. (2) The Sierra Madre fault and the Puente Hills blind
thrust fault of Shaw and Shearer (1999) appear to sole into the
decollement beneath the San Gabriel Mountains. (3) From our above
inference of fluid-filled cracks in the mid-crust of the San
Gabriel Mountains, we further interpret that the decollement
here is lubricated by fluids. (4) We have constructed a tectonic
model in which the brittle upper crust and ductile lower crust
are approximately separated by the decollements in the San Gabriel
Mountains and Mojave Desert. In response to a large component
of compression across the San Andreas fault, the brittle upper
crust imbricates along reverse and thrust faults, and the ductile
lower crust flows toward the San Andreas fault, from both north
and south directions, creating a crustal root centered beneath
the trace of the San Andreas fault. Chief
tectonic interpretations from Line 1 are as follows: (1)The geometry
of the bright reflections beneath the San Gabriel Mountains suggests
they are linked to a master decollement that extends from the
San Andreas fault southward to the hypocenter of the 1987 M 5.9
Whittier Narrows earthquake, and perhaps even farther south.
A symmetrical decollement is interpreted in the southern Mojave
Desert. (2) The Sierra Madre fault and the Puente Hills blind
thrust fault of Shaw and Shearer (1999) appear to sole into the
decollement beneath the San Gabriel Mountains. (3) From our above
inference of fluid-filled cracks in the mid-crust of the San
Gabriel Mountains, we further interpret that the decollement
here is lubricated by fluids. (4) We have constructed a tectonic
model in which the brittle upper crust and ductile lower crust
are approximately separated by the decollements in the San Gabriel
Mountains and Mojave Desert. In response to a large component
of compression across the San Andreas fault, the brittle upper
crust imbricates along reverse and thrust faults, and the ductile
lower crust flows toward the San Andreas fault, from both north
and south directions, creating a crustal root centered beneath
the trace of the San Andreas fault.
Preliminary velocity-modeling results from
Line 2 indicate the following: (1) The San Andreas fault is a
steeply dipping structure that separates upper-crustal blocks
having low velocities on the south and intermediate velocities
on the north, similar to results from Line 1. (2) The thickness
of sedimentary rocks in the vicinity of the Santa Susana Mts
(eastern Ventura basin) may reach 7- to 8-km depth. (3) A moderately
north-dipping low-velocity zone is observed in the upper crust
beneath the Santa Susana Mts, and a similar but fainter such
zone may be present in the Santa Monica Mts. Preliminary reflectivity
results for the middle and lower crust indicate the following:
(1) A moderately north-dipping zone of reflectivity is seen from
the beneath the north edge of the eastern Ventura (near the San
Gabriel fault) to the base of the crust at the San Andreas fault.
This zone projects upward toward the low-velocity zone described
above beneath the Santa Susana Mountains and may represent a
major crustal fault zone. (2) A reflector is seen dipping gently
to moderately southward beneath the Santa Monica Mts from the
vicinity of the Northridge hypocenter.
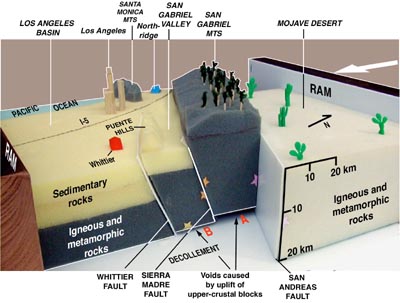
Photograph of foam-rubber model
of Los Angeles region based on the previous image. Only upper
crust resting on interpreted master décollement is shown.
Model has been squeezed in direction of convergence between Pacific
and North American plates. Relative motions between various blocks
is seen, as well as opening of voids beneath San Gabriel Mountains
block and Puente Hills-San Gabriel Valley block. These voids
may be represented in Earth by opening of tension cracks in bright
reflective zones A and B (see Fig. 2A) and injection of fluids.
Faulted stars on block edges represent schematically the three
moderate to large earthquakes of Figure 3. Note that block motions
are approximate for several reasons: (1) model is vertically
exaggerated (for visibility), (2) faulting beneath Puente Hills
has been simplified, and (3) south end of model is fixed, requiring
that San Andreas fault not offset décollement at base
of model. (In a more realistic model, San Andreas fault would
be fixed; it would penetrate décollement; and squeezing
of model would occur from both south and north, as shown in the
previous image.)
|
|
Lower-Crustal Structure, Tectonics
and Gravity Modeling Along the LARSE Transects, Southern California
Nicola Godfrey and David Okaya, University
of Southern California
Gary Fuis and Janice Murphy, United States Geological Survey,
Menlo Park
Rob Clayton, California Institute of Technology
Trond Ryberg, GeoForschungsZentrum, Potsdam
Bill Lutter, University of Wisconsin, Madison
Gerry Simila, California State University, Northridge
Combination of all data from the 1994 and
1999 LARSE active-source experiments produce two transects which
image crustal structure under the Los Angeles region. We present
P-wave velocity models derived from land explosion, onshore-offshore
refraction/wide-angle reflection, ocean bottom seismometer (OBS)
refraction/reflection, and vertical-incidence airgun reflection
profiles.
Transect I is 270- km long and extends
from San Clemente Island to the Mojave Desert, crossing the Continental
Borderlands, the Los Angeles and San Gabriel basins, the San
Gabriel Mts and San Andreas fault. This transect was collected
in 1994.
Transect II, west of Line 1, is 300-km
long and traverses the Continental Borderlands, the Santa Monica
Mts, the San Fernando Valley basin (1994 M 6.7 Northridge epicenter),
the San Andreas fault and the Mojave Desert, terminating at the
Garlock fault/Tehachapi Mts. This transect was begun in 1994
but completed in October1999 with the USGS-SCEC Northridge-to-Mojave
land explosion profile. Data merging of the 1999 data was completed
in Summer 2000; preliminary analyses have only recently commenced.
High resolution seismic tomography methods
have been applied to the onshore upper crust using the 1994 and
1999 land explosion data - see adjacent poster for results. These
shallow results along with shallow crust results for the continental
Borderlands from OBS tomography (ten Brink et al., 2000) can
be used to constrain the tomographic inversion of the deeper
crustal structure.
Along Transect I, the Mojave Desert crust
north of the San Andreas fault has a low-velocity (6.3 km/s)
mid- and lower crust and 28-km-deep Moho. South of the San Andreas
fault, beneath the Los Angeles and San Gabriel Valley basins,
there is a fast (6.6 - 6.8 km/s), thick (10-12 km) lower crust
with a 27-km-deep Moho. Further south still, the lower crust
of the Continental Borderland is fast (6.6 - 6.8 km/s) and thin
(5 km) with a shallow (22-km-deep) Moho.
Tomographic reconstruction of the deep
structure along Transect II combining the 1994 and 1999 data
has recently begun. Crustal thickness in the continental Borderlands
west of San Clemente and Santa Catalina is similar to that seen
along Transect I (~22 km). Gentle deepening of the crust begins
north of Santa Catalina and extends to under the northern San
Gabriel Mts at a depth of 35+ km. Mojave crustal thickness is
approximately 28-30 km based on nearby industry seismic reflection
profiles.
There is an 8-km-thick crustal root centered
beneath the surface trace of the San Andreas fault, north of
the highest topography in the southern San Gabriel Mtns. A simple
mass-balance calculation suggests ~36 km of north-south shortening
across the San Andreas fault in the central Transverse Ranges
could have formed this root. If north-south compression began
at 2 - 5 Ma (either when the 'Big Bend' in the San Andreas fault
formed or when the Transverse Ranges formed), 36 km of shortening
implies a north-south contraction rate of 7 - 18 mm/year across
the central Transverse Ranges.
|
A Preliminary Analysis of the LARSE
II Data
Zhimei Yan and Robert W. Clayton, California
Institute of Technology
We have begun an analysis of the explosion
data recorded along the main north-south line of the LARSE II
survey. This dataset consists of some 90 shots recorded by over
1000 receivers on a line 110 km in length. To date, we have converted
the data to an ISIS format, which has allowed us to examine the
records and to pick the first arrivals for most of the larger
shots.
It is clear from the data that the upper
crust has large lateral variations that are obscuring later arrivals.
Based on the short-offset first-arrival picks we have constructed
a simple upper crustal model that will allow us to correct this
contribution out of the data in order to look for coherent lower
crustal arrivals.
One aspect of the upper crustal arrivals
that is intriguing is the refracted arrivals for the shots between
the San Andreas and Clearwater (25 km south of the SAF) faults.
These refractions all have slow arrivals that are coincident
with the faults and are independent of the source location. We
have used a finite-difference method to test various types of
models to explain this observation. Our preferred model has an
uplifted block of high velocity material.
|
Preliminary Results of Crustal Structure
from the LARSE-II Passive Recording Experiment Using Teleseismic
P-to-S Converted Waves
Lupei Zhu, University of Southern California
The 1999-2000 Los Angeles Region Seismic
Experiment (LARSE-II) contained a passive recording phase in
which 83 three-component broadband and short-period instruments
were deployed along a 100 km long profile. The profile started
near the coast of Malibu and transversed the Santa Monica Mts,
the San Fernando and the Santa Clarita Valleys, the San Gabriel
Mountains, the San Andreas Fault (SAF), and ended in the Antelope
Valley of the Mojave Desert. This passive recording experiment
lasted 6 months and has recorded numerous regional and teleseismic
events. In this study, we used teleseismic P-to-S converted waves
to image subsurface sedimentary basin and deep crustal structures.
We first analyzed 4527 three-component P waveforms from 87 teleseismic
events ranging from 30 to 95 degrees in epicentral distance.
For each event, we aligned all station records at the first arrivals
by cross-correlation and stacked all vertical waveforms to estimate
the effective source time function for the event. We then deconvolved
this common source time function from all records to compute
station receiver functions. A total of 2362 receiver functions
were obtained. We generated a 2-D crustal structure image along
the profile by stacking and migrating the radial receiver functions
using the Common Conversion Point (CCP) stacking technique. The
image shows three sedimentary basins under the San Fernando,
the Santa Clarita, and the Antelope Valleys. Their depths vary
along the profile and reach a maximum depth of 6 to 8 kms. In
the deeper part of the section, the Moho is seen clearly as a
continuous flat feature at a depth of 34 km under Mojave.
It terminates near the downward extension
of the SAF. The deep structure under the San Fernando Valley
and the Santa Clarita Valley is very complicated. There is no
detectable P- to-S conversions at a depth range of 20 to 40 km
between the Santa Monica Mts. and the San Gabriel Mts. Instead,
several separated conversion bands can be seen at a depth range
of 40 to 50 km, which might suggest thickened crust. We also
compared the Bouguer gravity anomaly and teleseismic arrival
time delays along the profile with the predictions from the inferred
crustal model. The preliminary modeling shows that most of the
anomalies can be explained by the shallow sedimentary basins.
|
|

